Every week a tissue culture lab has to answer one question before it does anything else: what needs to move? Which cultures are due to be subcultured, which are ready to advance, which are ready to ship. One chart answers all of it at a glance, and it is the chart I open first every single week.
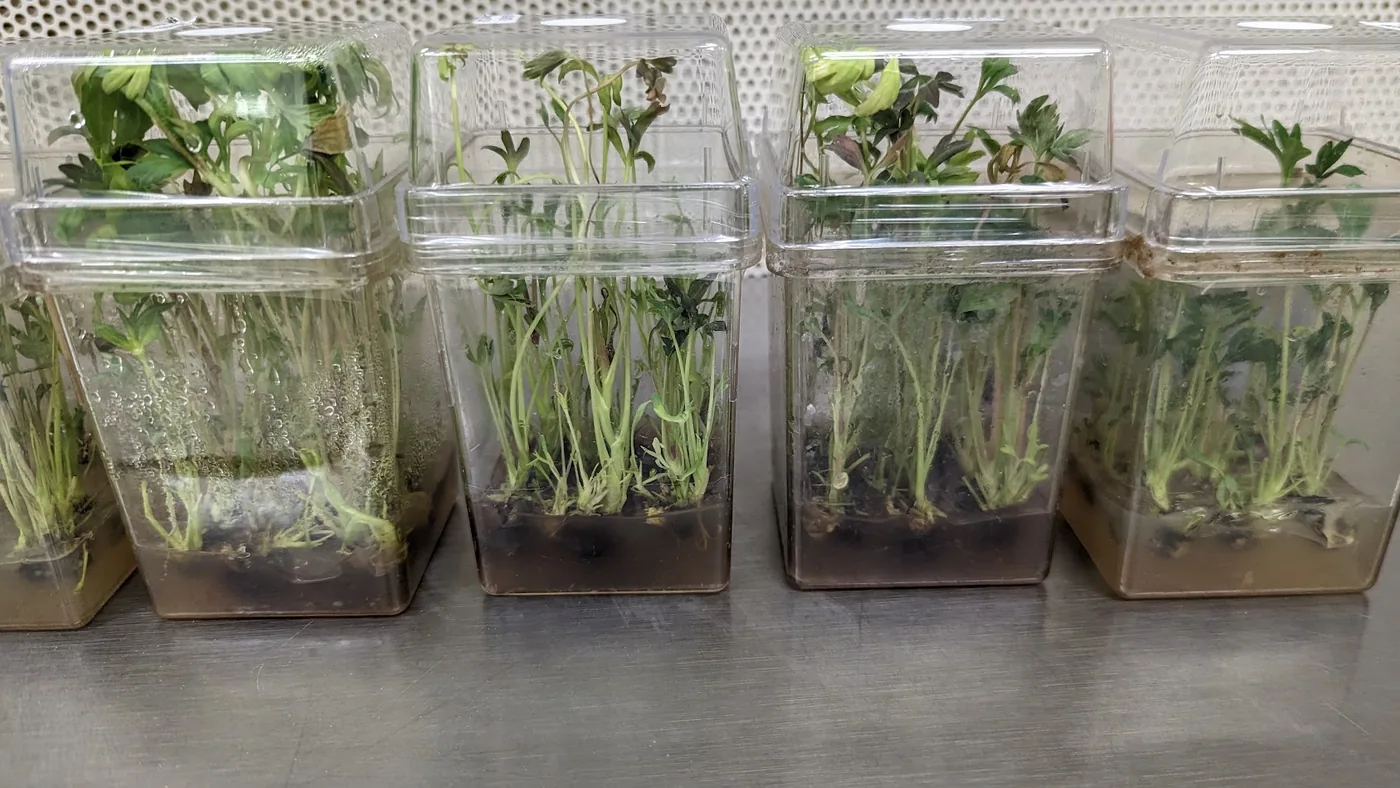
It is not a fancy chart. It is a stacked bar of the plants you currently hold, grouped by the week each lot was made. But because it is placed by age, it quietly tells you your whole work list. This is how it is built, and how to read it.
One bar per week, colored by where it is
Each column is the inventory you hold right now, sorted into the week its lot was created. The height of a column is a plant count. The colors are the growth stage each lot sits in. Because every bar is placed by the week the material was made, the chart is really a picture of age: the leftmost bars are your oldest inventory, and the right edge is what you made this week.
Net inventory = plants you made, minus plants you have already used, minus plants merged out of the lot.
Made. The initial count when the lot was created. Used. Everything pulled from that lot into the next stage, plus losses. Merged out. When you combine small lot numbers into one, the emptied lots drop off so nothing is double counted.
The result never shows a plant twice, and never shows a plant you no longer have. What is on the chart is what is physically on your shelves.
The production line
Here is one of the production networks we actually run. Multiplication is the engine: every subculture multiplies the material about 2.5 times. From there it flows one way down the line, into Base, Pre-Rooting, Induction, Rooted Transitioning, and finally Shipping. Each arrow carries a rate. A percentage is the share that survives the step. A multiple, like 1.4 times, is a step where one culture is cut into more pieces. The chart below is built from this network running at a steady pace: 10,000 plants made in Multiplication every week, trickling down the line at each of these rates.
Why age is the whole point
Every stage has a residence time, printed on each box in the diagram: the days a culture sits there before it moves to the next stage. Multiplication is 35 days, which is five weeks, so it fills five columns. Rooted Transitioning is 42 days, six columns. Induction is only seven days, a single column. Each color runs one column for every week of its residence, from what entered this week to the oldest week still on the shelf. That oldest week is the one up for work, so within each color the leftmost bar is your list for this week. For Multiplication, that means the cultures to subculture.
Here is that chart, built from 10,000 plants made in Multiplication each week trickling down the line. Shipping is left off: once plants ship they are no longer inventory you hold, so the chart stops at Rooted Transitioning, the last stage still on your shelves. The right edge is this week, and every column to the left is one more week back from today. Switch between growth stage and the medium each stage runs on.
Growth stage is the view you act on. Medium is the view you plan supplies from: it stacks the same plants by the recipe each stage runs on, so you can see how much of each medium you need to make this week.
From a chart to a move list, every week
Reading it is one motion. Within each stage, the bars older than that stage's residence time are ready to move on. The panel under the chart does the arithmetic for every stage at once, and turns the picture into a move list you can hand to a hood tech: how many to subculture, how many to advance, how many to ship.
This is where the inventory chart meets the production network. The network knows the rate of each step, so once you know how much you are subculturing this week, you know roughly how much you will hold at every downstream stage next month, and whether that clears your orders or leaves a gap. The inventory chart is the present. The network turns it into the forecast.
| Stage | Residence | What the chart is telling you |
|---|---|---|
| Multiplication | 35 days | the engine. oldest bars are due to subculture |
| Base | 35 days | oldest bars ready to move to pre-rooting |
| Pre-Rooting | 28 days | ready to move into induction |
| Induction Large | 7 days | moves fast, clears in about a week |
| Rooted Transitioning | 42 days | oldest bars are ready to ship |
Open this chart first, every week. Left to right is old to new. Within each color, the oldest bars are work waiting. Almost everything else you do with it is a variation on that one read.